What you bring.
Agent TrustKit measures how trustworthy your AI agents are (grounding, policy compliance, tool safety, reliability, cost, drift) against your own data, offline, without wrapping your code or phoning home. You bring two things: a short contract saying what your agents are supposed to do, and the standard OpenTelemetry they already emit. What separates a good evaluation from a great one is how much depth is in that telemetry.
What your agents are supposed to do.
One config file (contract.yaml) stating the job, the rules, and the guardrails. It's the yardstick every evaluation measures against, and it doubles as the agent-inventory and governance artifact frameworks like NIST expect you to have on file anyway. It's data, written once per project. Not code, not instrumentation. And you don't write it alone: trustkit init can scaffold it from an archetype pack, and we fill it in with you from the questionnaire below.
One file. The whole definition of done.
- Objective & success criteria: what the agent is for, and how you know it worked
- Prohibitions: what it must never do
- Policies: the rules it always follows (review gates, nothing touching auth, payments, or secrets without sign-off)
- Tool allow / forbid: which actions are permitted, forbidden, or high-risk, with the risk taxonomy per tool
- Autonomy tier & human gates: the declared tier and oversight boundary, where a person approves, what triggers an escalation
- Budgets & cohorts: cost, time, and step ceilings, plus any groups you want compared for fairness or consistency
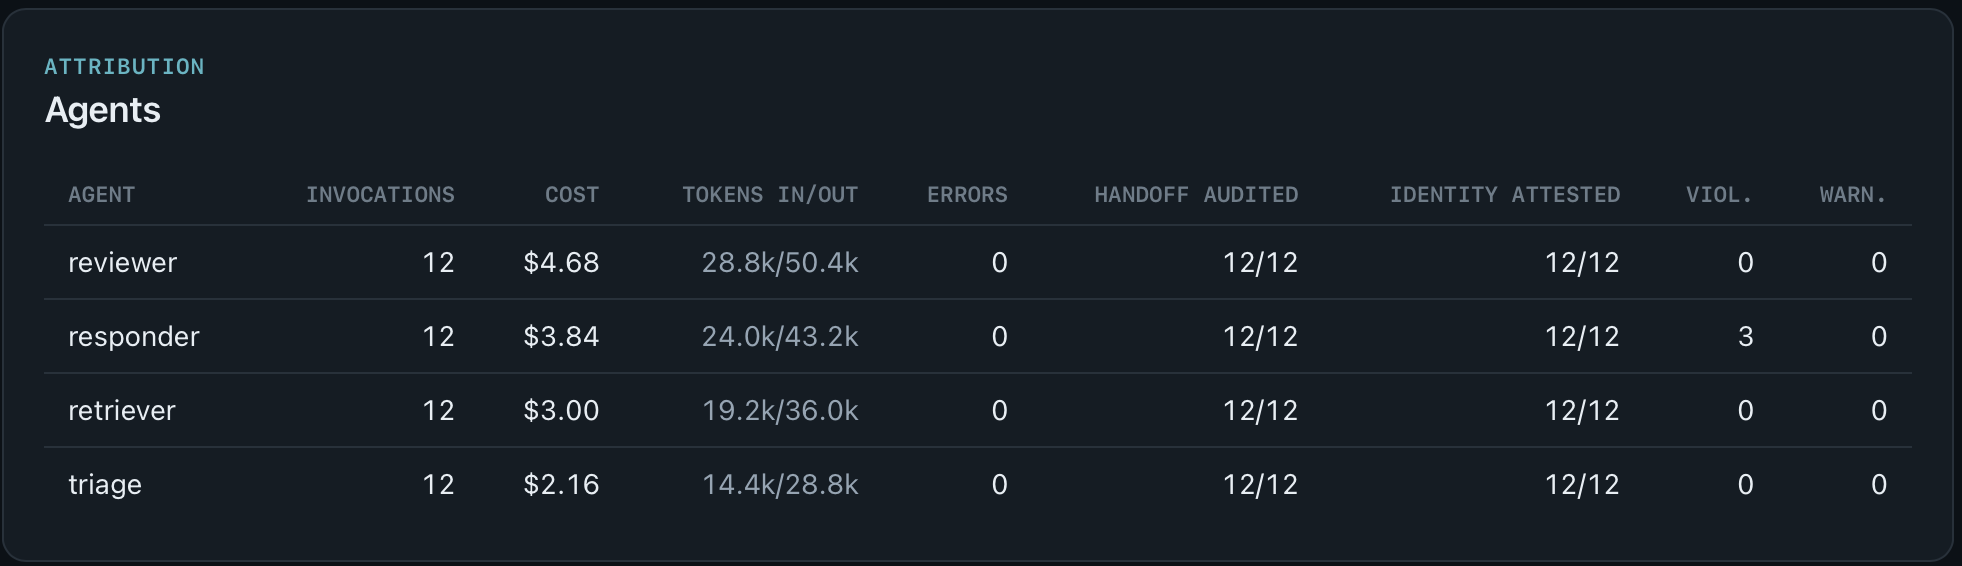
- Agent roster: one agent, or a pipeline of named roles and how they hand off
Standard OpenTelemetry, not bespoke.
Agent TrustKit reads the OpenTelemetry your agents already emit (GenAI semantic conventions). If you're instrumented, directly or through LangGraph, the OpenAI Agents SDK, Langfuse, or Phoenix, there's a good chance you don't touch your code at all. You emit standard telemetry and an Agent TrustKit adapter maps it onto our model. The baseline we need per run:
1. each agent invocation with its input and output
2. each tool call with its name, arguments, and, critically, its results
3. timing, tokens, and cost
The more you capture, the more we can verify. Retrieval sources unlock groundedness. Cohort tags unlock fairness and consistency. Handoff signals unlock the escalation checks. Pick the export path that matches your stack; the first thing we run against your file is a read-only preflight (trustkit inspect) that reports what it can and can't support before any evaluation happens.
Amazon Bedrock Agents
Your InvokeAgent calls already produce a full trace with enableTrace=True. Write the trace events to a JSONL file, which is about ten lines wherever you invoke the agent. Knowledge-base lookups carry the retrieved passages, so hallucination and omission checks work on this path with nothing extra from you.
import json

response = client.invoke_agent(
    agentId=AGENT_ID, agentAliasId=ALIAS_ID,
    sessionId=session_id, inputText=user_input,
    enableTrace=True,
)
with open("bedrock-traces.jsonl", "a") as f:
    for event in response["completion"]:
        if "trace" in event:
f.write(json.dumps(event["trace"], default=str) + "\n")OpenTelemetry / AgentCore
If your agent is instrumented with OpenTelemetry (ADOT or any OTel GenAI instrumentation), we ingest standard OTLP trace exports in JSON, pretty-printed or not. Easiest route is a file exporter in your collector pipeline, or OTEL_TRACES_EXPORTER=console on a test run. One heads-up: standard GenAI telemetry doesn't carry retrieved-passage text, so this path covers policies, budgets, tool use, and reliability out of the box, and groundedness and omission checks need a small enrichment we scope together.
Your own logging
If you log requests, tool invocations, and results anywhere at all (CloudWatch, a database, flat files), that's enough to work with. We write a small adapter against your log schema, usually half a day, and it's yours to keep. Send us about ten runs' worth of logs to write it against.
Nothing logged yet
Also fine, and more common than you'd think. We wrap your agent's entry point with a recorder, or hand your team a short instrumentation patch, then run it against a task set we design together. You come out of it with step-by-step execution tracing that's useful whether or not you ever evaluate anything.
Observe vs. prove.
This is where most setups come up short. There's a difference between telemetry that shows what an agent said it did and telemetry that lets us prove what happened. Two things matter more than the rest.
Complete results, and out-of-band ground truth.
- Full results, not truncated: a 4 KB prefix of a test run cuts off right before the failure at the bottom, and we can't confirm "tests passed" from a fragment. Capture complete tool results, with the big ones as span events or logs.
- Authoritative ground truth for anything high-stakes: on coding or multi-agent pipelines we need out-of-band facts, the real diffs and who wrote each change, rather than the agent's narration of them. Checking an agent's story against its own story proves nothing, because a misbehaving agent is writing both sides.
The questions we walk through.
You don't write the contract alone. These are the nine questions we work through together to get one:
Nine questions to a signable contract.
- What is this agent or pipeline supposed to accomplish, end to end?
- What does a good outcome look like, and how do you know it succeeded, versus stalled or went wrong?
- What must it never do? (hard prohibitions)
- What rules must it always follow? (e.g. changes only merge through review; nothing touches auth, payments, secrets, or migrations without human sign-off)
- Which tools may it use, which are forbidden, and which are high-risk (irreversible, external, or financial)?
- How autonomous is it? Where does a human approve, and what should trigger an escalation?
- Any budgets, like max cost, time, steps, or tool calls per run?
- Are there groups to compare for consistency or fairness (customer tier, region, task type)?
- Who are the agents and how do they coordinate: one agent, or a pipeline of named roles? Is the orchestrator deterministic?
The onboarding checklist.
Work through this, and you're set.
- ☐ Contract written: objective, success criteria, prohibitions, policies, tool allow/forbid, autonomy tier and gates, budgets, cohorts, agent roster (we build this with you)
- ☐ Telemetry exports standard OTel: GenAI semconv, to a JSON file or a collector we can pull from
- ☐ Per run: agent invocations (input + output), tool calls (name + args + results), timing, tokens, cost
- ☐ Tool results captured in full: not truncated, with the large ones as span events or logs
- ☐ For coding / multi-agent work: authoritative ground truth, meaning the real diffs and who wrote each change, emitted at the gate instead of taken from the agent's narration
- ☐ If relevant: retrieval sources for groundedness, cohort tags for fairness, handoff confidence for escalation
- ☐ Secrets scrubbed at capture: Agent TrustKit works fine with redacted content and reports "unverifiable" instead of guessing
Runs on your data, in your environment.
Your data, your call.
- Local by default: the deterministic evaluation (policy, budgets, tool use, reliability, PII and secrets pattern checks) runs entirely against your file. No collector, no account, no phone-home.
- The AI-analyst step is optional and needs your sign-off: groundedness and omission checks send your agent's outputs and retrieved passages to the Anthropic API for analysis, and those inputs aren't used for model training. Decline it and those dimensions come back unevaluated, so the gate returns INCONCLUSIVE rather than a pass
- Derived reports, never raw traces: Agent TrustKit emits a trust profile and findings. It has no path that exposes or ships your raw traces, including in the viewer.
- Can't leave your environment at all? We point the analyst at a Bedrock-hosted Claude inside your own AWS account instead
- Gaps are findings: thin traces still produce the deterministic profile, and where we can't verify a claim we say so and point at exactly what's missing. A dimension nothing could check is recorded as unevaluated, never as clean
A contract, your traces, one free report.
Send the export, or just the questions, and we'll run the read-only preflight first so nobody gets surprised.
Talk to us →[email protected]